
Generating workflow diagrams for TFS work items
In my current position as the Technical Lead of Product Development I have several responsibilities. One of them is the definition and implementation of our development processes. We’re using Team Foundation Server, which supports rich customization of the process configuration, especially the workflow of work items.
To document the workflow of our work items, I wanted to create perspicuous charts. However, if you’re a nerd like me, you don’t want to use Powerpoint or Visio to create high gloss charts. Instead I like to automate the creation of the charts.
Fortunately, the XML format of work item template definitions (WITD) is well-documented, see
All WORKFLOW XML elements reference.
To get the XML file of a WITD, you can use either the Visual Studio Add-in
TFS Process Template Editor
or use witadmin:
witadmin exportwitd /collection:CollectionURL /p:Project /n:TypeName [/f:FileName]
On the other end, the Graphviz suite includes a nice
small tool named dot to draw directed graphs as PNGs, reading the defintion
of the graph from a text file.
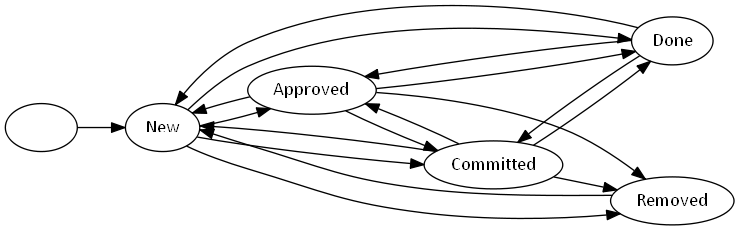
The challenge was now to convert the XML of the WITD to the DOT language. But that’s quite easy to accomplish using Powershell. But before I show the script, first a picture of the default workflow for bugs from the Scrum process template:
And here’s the script:
If you pay close attention, you may notice that if only certain users or groups are permitted to change a work item to a specific state, the graph will show this too. E.g. if only members of the QA are allowed to move a but from the Done state, the graph will look like this:

Nevertheless, the script was written in a short time, it does what it should do without any error handling. However, it suits my needs. Maybe yours as well.
Leave a Comment
Your email address will not be published. Required fields are marked *